My interest, perhaps obsession with the heart, stems from my family's history of heart problems. My father passed away in his early 40's and my younger brother Jim died with a heart ailment in this early 40's too. I have two brothers and a mother surviving in my family, but all three are taking blood pressure medicine to prevent a possible stroke. Just recently ( January, 2001) a doctor placed me on blood pressure medicine too.
I started my study of the heart over twenty years ago when my younger brother Jim had undergone heart transplant surgery on his 35th birthday. A virus had attacked his heart and caused the situation. He survived the operation and led a cautious but otherwise normal life for about 7 years. Then he died.
During those seven years, Jim and I talked about his problem. He was fascinated by how medical science had allowed him to continue living. His close brush with death, reminded me of how surprised I was when our father died; and how finite all of our lives are.
I decided to take up jogging and get into shape at that time. I had been a good runner on the track and cross country teams back in high school. I was approaching 40, and acutely concerned about my own mortality.
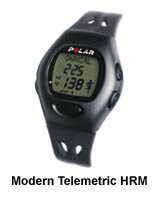
I majored in mathematics for a portion of my many years in college. The study of math had honed the analytical side of my personality; and my curiosity of the heart was beginning to place those tools of thought into action again. I had purchased an electronic heart monitor that could be worn when I jogged. It had cost me a small fortune. It was one of the earlier models with hardwired connectivity from gel-like chest electrodes and a microprocessor that had a small liquid crystal display (LCD). The processor snapped to a belt that was wrapped around my waist as I ran.
It was a forerunner of the wireless telemetric monitors that are today sold by companies like Polar to all types of athletes. The newer models have receivers that are worn on the wrist, and the chest electrodes are sealed in a plastic chest strap.
As I watched the unit's large digital numbers display the heart rate, and see it change in almost real-time to my activity level, I was trying to figure out the process. How was it doing it?
I wasn't concerned at that time with the processing unit per se. I was more curious about how the electrodes were picking up some sort of signal. What was the source of the electrical current that was surging through the tiny wires attached to the electrodes, I wondered?
I didn't realize at the time that those initial questions in my mind would lead me on a journey of epic proportions. On reflection, it was impossible for me to know that I would not stop with the search for answers to the electrical characteristics of the heart. I had no way of knowing that my "getting in shape" jogging would turn to racing; and that my math would play a major role in the training. Even more obscure was the possibility that I would sell some secrets of my findings to an international sports company. And these are only a few of the surprises that were in store for me along the way.
I recruited a neighbor that was close to my age and shared my interest for getting into shape. This was the era of Jim Fixx and the jogging craze was causing all sorts of people to hit the neighborhood streets and local tracks. The neighbor and I started our jogging plan by going out and buying a good pair of running shoes. I hadn't had a pair of running shoes on my feet for over 20 years. I forget what brand they were, but I don't think the company is still in business. This was long before Nike was a household word.

I recall we went up to the local high school track and attempted to jog a mile. I say "jog" but it was more like a sprint. We were both very out of shape, and the close to 8-minute mile felt almost like an all-out effort. I had run sub 5-minute miles routinely when I was in high school. How could this be? It was really discouraging,but we both vowed to stick with it.
I had worn my heart monitor to the track workout. The gel pads were snapped to a cloth chest band that held them in place. It looked a little like I was wearing a bra; and I was just daring someone to make a wisecrack. It was a hot day, and the cloth and gel became a wet, soggy mess. The monitor worked well though. I think my heart was soaring at about 180-183 bpm as I finished my 8 minutes of running. I recall that my neighbor wasn't too impressed with the apparatus. The neighbor stopped training after about 2 months, but I continued. He probably didn't like the idea of running with someone who looked like a cross-dresser.
I found that after about 10 or so workouts, the gels would literally melt down. And the cloth band had to be laundered daily. I ordered more pads and a backup chest band. I never went jogging without the monitor. I recorded my heart rate manually in a diary every day. I began to see improvements within just a few weeks. I had no idea where I was going with the information; and I still had not gone out to Emory University to try finding some medical books that would explain the mechanics of the heart. The university was about 25 miles from my house, and I would have to cut through downtown Atlanta to get there. Driving through downtown Atlanta has always been one of my least favorite things to do.
The turning point to all this clueless jogging really happened when I purchased some "running books" at a local bookstore. I purchased nearly everything on the shelf that had anything to do with scientifically approaching the sport of running.
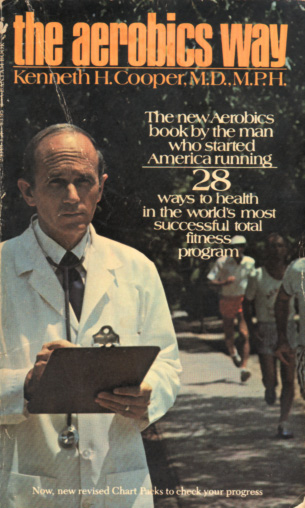
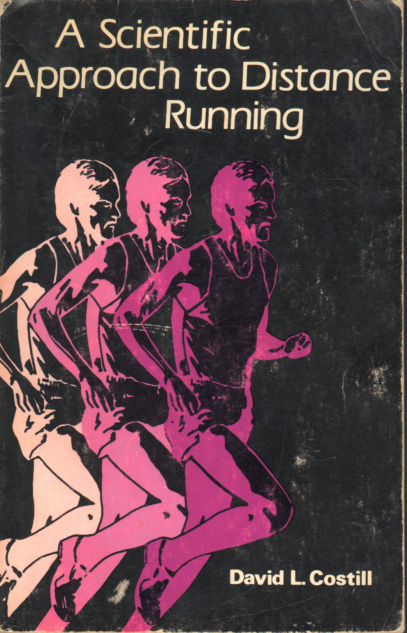
The most scientific of all the books I purchased was the one by David Costill (A Scientific Approach to Distance Running). Dr. Costill had devoted a great amount of of his research to the study of world class runners. It was extremely detailed with lots of charts and math equations. I was gaining a better understanding of how running affected heart rate and the heart's physiology. One statement that stuck with me over the years was the fact that his studies showed that there was little correlation between people having a high level of slow twitch skeletal muscles (high aerobic capacity) and good blood pressure profiles. But on the other hand, he found that middle-distance training could improve the blood pressure profiles among runners. This did not mean much to me at the time, because my blood pressure was not a problem.
There was one other study in Costill's book that stuck out in my mind too. He was puzzled, as was the rest of the scientific world, with the data he gleaned from studying two world-class middle distance runners, Derek Clayton and Frank Shorter. Costill, like many others, had found a strong correlation between a person's oxygen uptake (utilized oxygen volume per unit of time) and their middle distance racing performance. With all world class runners, oxygen uptake numbers were well over the 70 ml/min/kg of body weight. However, Frank Shorter and Derek Clayton...undisputably two of the best runners of all time..were exceptions. They were well below this 70 figure. Why? He had observed, however, that they could run for unusually long periods of time at a high percentage of their maximum oxygen uptake, and at a point where most people start producing energy inefficiently and pool lactic acid. He was not sure exactly why. This and many other findings in his book were really stimulating my thinking. In fact, the mathematical "secret" that I sold to a sports computer software company 10 years later stemmed from my personal hypothesis as to why he was getting the strange results when testing Clayton and Shorter.
This research was the beginning of an addiction for me. I became what I would call a "book junkie". It was becoming financially dangerous for me to go into a bookstore. It was a like a drug. I wanted to read everything.
By this time too, I had evolved from a jogger to a runner. One of the books, Bob Glover's "The Runner's Handbook", had provided me with a perfect planning guide for not only assessing my degree of "in-shapeness", but also how to set realistic and attainable goals.
I was running with a different crowd now. My body weight had gone from near 200 pounds to 173. None of us were fat by any stretch of the imagination. We all shared one goal: Become faster at middle distance running. I was hooked!
I stood out in the crowd though. I was a lot taller (6'2") and I was the only one wearing all sorts of electrical gear. At one point, I was wearing a heart monitor, a velocity doppler with a built-in synthesized voice that reported my pace at regulated intervals, and a stopwatch with a built-in audible metronome. I am sure that even to my running friends I looked like a freak from some sort of side show.
They used to joke about not running near me when there was a chance of a thunder storm. They were certain I would be like a mobile lightening rod with all my electrical connections. They would openly scoff at my belief that science could play a major role in running potential. They followed the well-known regimine of training that, thanks to runners like Jeff Galloway who later became authors, was being preached to all runners. That is, we would regularly do aerobic, threshold and speed workouts. Most often, we did the aerobic and threshold runs together, but found the time to do our speed workouts separately. I won't waste the reader's time explaining these types of training. You can read about them elsewhere in these Web pages if you are interested.
None of the joking and strange looks from others deterred me though. I continued documenting every workout with data about my heart physiology. I continued buying more and more books,trying to confirm my findings as well as confirming the scientific findings being reported by others.
I started turning my data into equations. Sometimes I would have the benefit of the science community's formulae. Other times, I would derive my own equations based on a process called "curve fitting". My own personal data was not enough for credible curve fitting equations, because I was a universe of one. I started subscribing to scienitific journals and making regular trips to Emory University's library to search the books and archives. The mathematical model that I was creating was growing and growing. I was finding patterns. I was entering a world totally unknown to me previously.
My math background was finally being put to the test. I was even challenging formulae of others...reputable scientists, physiologists, and doctors. For example, I had concluded that the linear equations attributed to maximum heart rate predictability did not reflect the data available. I did my own curve fitting for the data and found it to instead be logarithmic. (especially when the universe of people tested includes the age range from teen adolesence to those people well over 60) Nobody had the opportunity to prove me wrong, because I never discussed my findings with anyone. That is at least, my findings remained just in my journals and the archives of my brain until one day I walked into the office of Coach Roy Benson.
 Roy is about 3 years older than me. When he was in high school and college, his specialty was 800 meters. After a stint in the
armed forces, he became a coach at a college in Florida. He also acquired a masters degree in exercise physiology. When I met Roy he was living in
the Atlanta area and coaching casual runners. He had few elite clientel. But during his tenure as a college coach, he had coached Galloway and Shorter for a period
of their running careers. He had even been asked one year to travel to the Phillipines and coach an Olympic team there. He really knew
his business.
Roy is about 3 years older than me. When he was in high school and college, his specialty was 800 meters. After a stint in the
armed forces, he became a coach at a college in Florida. He also acquired a masters degree in exercise physiology. When I met Roy he was living in
the Atlanta area and coaching casual runners. He had few elite clientel. But during his tenure as a college coach, he had coached Galloway and Shorter for a period
of their running careers. He had even been asked one year to travel to the Phillipines and coach an Olympic team there. He really knew
his business.
A running friend had told me about Roy. I went to visit him in order to find out if he would be willing to become my coach. Of course, he was interested. That's how he was earning his living. During our initial interview, he told me that I would have to wear a heart monitor if he coached me. This was music to my ears. He had no idea that I was such a coach's dream. He did not know that a heart monitor to me was like the blanket to Linus in the Peanuts cartoon strip. I could not be without it.
Roy won my confidence immediately, I soon was telling him all about my studies. Unlike everyone else I had talked to though, he really listened with great interest. There were no glassy eyes and snoring sounds. He was genuinely interested. I had stored some of my mathematical algorithms in a programmable calculator. I showed him how I could compute pace for different types of training based on personal variables that a runner inputs. I showed him how a stopwatch could be almost replaced with the heart monitor. Roy was using heart monitors, but he did not know exactly how to maximize their use for training. Primarily, he was using the monitors to keep his runners from overtraining and to measure cardiovascular progress. But he was primed to go on to the next level. I was anxious to help him get there and at the same time use his other runners to verify some of my theories and formulae. From that time forward, he threw in his coaching for free.
Roy was not sold on training via computers. It was the 1980's and not everyone had a home computer. And Roy wanted something that he could use track-side. Portable computers were not a fact of life yet.
A physiologist named Ned Fredericks had supplied him with a nomograph that related heartrate to predicted oxygen uptake, but it did not relate directly to training effort. He asked me to give Ned a call and see if he and I could expand the chart to include the effort relationships that I had linked to heart rate and oxygen uptake. Together Ned and I were able to do this. However, I had to first learn how to design multi-axis nomographs.
Learning how to design nomographs should have been easy. I should have walked into any bookstore and bought a book on the subject. But life is not so simple. Such books had been out of print for years, dying in usefulness and popularity just before slide rules disappeared. I didn't give up looking though. I was handling a trade show setup for a company in Detroit one day when I accidentally ran across a 3-story building close to the downtown area. It housed nothing but old used books. There I was able to purchase several books on this forgotten lore.
Roy soon had a nomograph that all his trainees could easily use and understand. We even gave permission to Polar to reprint the chart in several books that were being shipped with their telemetric heart monitors.
It was great working with Roy and having the benefits of his coaching. I was learning more about physiology. When I ran across something that I didn't quite understand, he would explain it so that it was easier to understand. At the same time, he was learning more about how to analyze data. Eventually Roy and I put our experience and knowledge together for a joint business venture.
"PC Coach" software ended up signing a contract with us. I would supply the computer algorithms and Roy would provide them with a respected coaching name and training methodology. The software company would put the two together and emulate a training method in a computer. Over the years, it has been a profitable arrangement for all of us. Roy and I receive quarterly royalty checks. It's a good source of "mad" money, but it didn't make either one of us rich.
This fast-paced personal history lesson moreless brings the reader up to the present date. I am just a jogger now. I weigh about 20 pounds more than my 173 weight when I was competing at running. That is not fat, but it is also not an optimal racing weight. My focus now is just to stay in shape.
I never stopped studying the physiology, however. When I learned about my blood pressure problems, I again started to review my
earlier reading to find some answers. I started with the basics of the heart and how it operates.
The heart is a 4-chambered double pump. There are actually two pumps with a thick wall (septum) separating each
of them. The pump on the right side of the heart is pumping blood to the lungs, whereas the pump on the left
pumps blood to the tissue. These two systems, in terms of blood flow, are circularly connected.
That is, with all their separate plumbing and their close nexus with the lungs, they form a closed loop.
During each minute, the blood flowing out of the right side of the heart equals exactly the amount of blood
flowing into the left side of the heart.
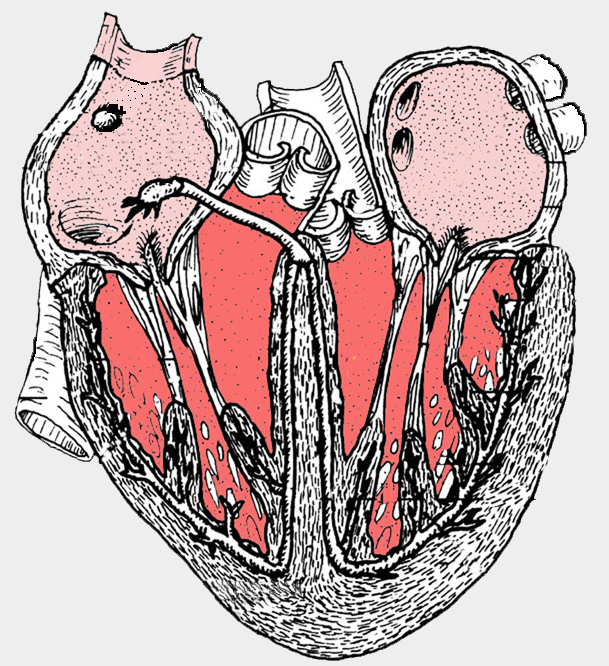
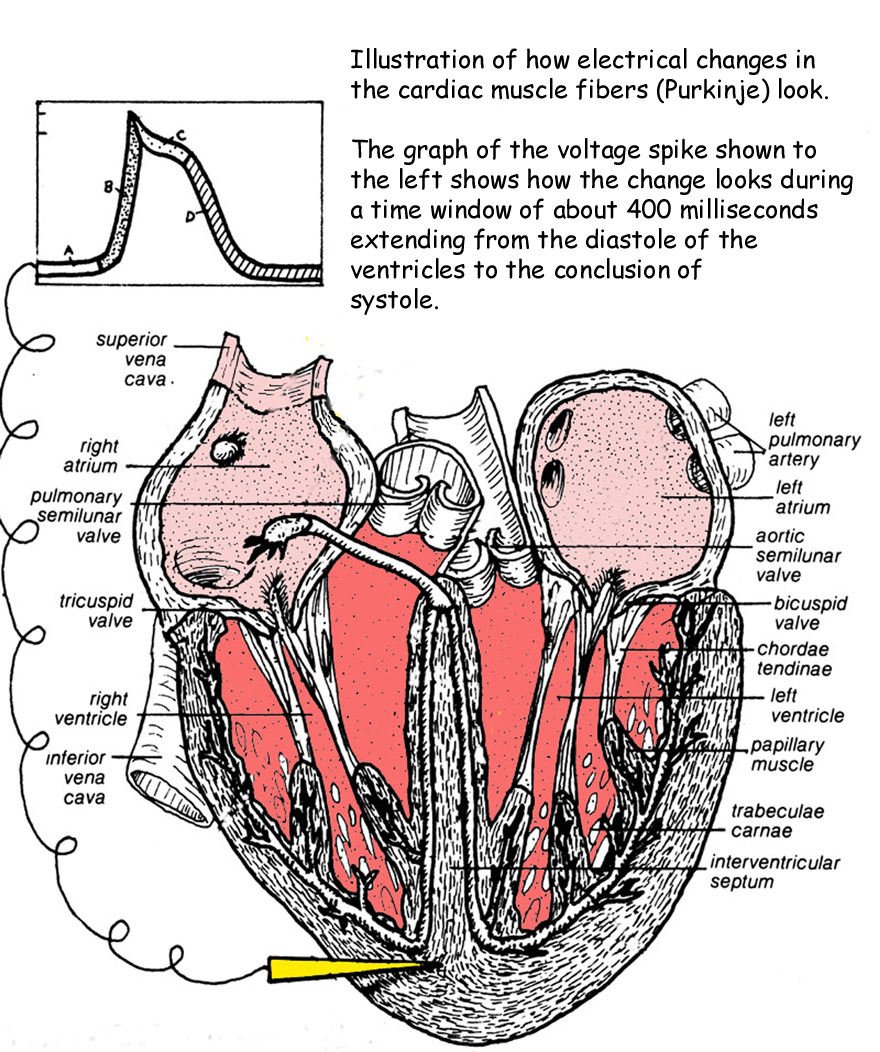
The heart is a hollow organ, with walls made from specialized muscle fibers called cardiac muscle. Rapid electrical stimulation causes the muscle fibers to shorten, thicken
and squeeze on the hollow cavities of the heart. Below is a cutaway diagram of the heart with an electrode attached to the ventricular wall.
This electrode and wire is pictorially connected to the graph at the top in order to show "potential" levels. There are two
variable power sources responsible for making the heart "beat". The primary source is the one that is directly stimulating
the cardiac muscle fibers (called Purkinje fibers); and the second source is stimulating the sinoatrial and atrial
ventricular nodes with the help of nerve impulses. I will cover the Purkinje fiber stimulation first; and then
cover the nerve-stimulated chemical activity later.
Stimulation of the Purkinje Fibers
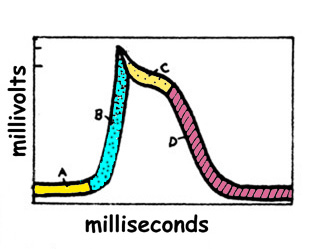
Take a close look at the graphical curve that shows the electrical changes that are taking place in a Purkinje fiber
during the ventricular excitation. I have shown the curve further down on this page, so you don't have
to scroll upward.
The height of the curve is the measured potential (millivolts) at the point where the heart is changing from diastole
to systole. The horizontal axis represents the passage of time in terms of milliseconds. Although the the time
interval shown for the segment defined by "BCD" is only about 300 milliseconds of a healthy body at rest, the total
time interval between contractions is quite long compared to skeletal muscles. An average person, for example, has
about 70 of these voltage peaks per minute. Remember that there are 60,000 milliseconds in one minute.
The letter "A" refers to the "diastolic potential" or what is actually the start of the diastole mode. The heart alternates from a resting mode (diastole) to
a contracting (systole) mode. The contraction of the fibers of the cardiac muscle differ from other muscles in
the body. That is, unlike other muscles which can contract independently of each other, the cardiac muscles follow
an "all or nothing" process. They all contract together. They are able to do this through rapid electrical changes
taking place between the outside and inside of the heart tissue.
The letter "B" refers to the point in time of the diastole when the cardiac muscle fibers of the ventricles are "most permeable
to sodium ions". "A" and "B" together define the diastole.
The letter "C" refers to the point in time of systole when the cardiac muscle fibers of the ventricles are "most permeable
to calcium ions". And "D" is when they are "most permeable for potassium ions". "C" and "D" together define the
first stages of systole. In other words the permeability characteristics of the heart tissue are changing,causing
rapid voltage changes through chemistry, and these changes are causing the contractions (pumping action).
The dictionary in my office defines the world "permeable" as "having pores or openings that permit liquids or gases to
pass through a membrane". This is sort of what is being discussed here. Ions are chemical elements that are floating around in
the liquids of the body (blood,etc.)and constantly passing through various "membrane-like" media when the conditions are
just right. And believe it or not, it is this rapidly changing permeability that allows the chemistry to provide the electrical jolts
that cause our hearts to beat.
A chemical potential can be created between various elements when the matchup of elements and connective chemistry is just right. You
may have, in fact, unwittedly created such a "just right" condition yourself if you ever touched a piece of "tin" foil to a metal filling in your
tooth. (Don't try this, if you haven't!) The result of the silver-based filling and the aluminum foil being connected through
the chemistry of your saliva was most probably like my own unpleasant experience. You felt a really sharp pain through the nerve
endings of the filled tooth. It was enough of a jolt so as to teach you not to do it again.
You may be wondering where I am heading with all this. In simple language, the heart is controlled by electrical
potentials that are ever-changing during the trillions of millisecond time intervals marking the cycling of the bodily
events. The three ions sodium, potassium and calcium have their own pathways or channels for entering the heart muscle
cells. The heart's pumping action is accompanied by the sequential opening and closing of these ion channels. Somehow each
channel has a way to discriminate so that only the proper ions can gain passage.
If you remember studying battery operation in science class, you may recall the polarization characteristics of it. With
the battery, you will recall, there were distinct poles we labeled "negative" and "positive". Likewise in the "membrane" of the heart, there is a polarization
between the inner and outer surfaces. To this end it is an electrical cell. However, because of the selective channeling of
the calcium, potassium and sodium ions, it becomes a variable battery. That is, the voltage is changing as the various
channels come into play.
So you may well ask, as I did, how does this variable battery operate in this heart circuit, and why do we need it?
The answer to this question was found by scientists actually measuring the potentials of the heart. It was found that
during the start of diastole, when the atriums and ventricles are at total rest, the membrane potential is a negative
70 millivolts. By conventional definition, the physiologists have chosen to speak of the membrane as being "polarized"
when it has this negative status. As time passes during diastole, the potential begins to drift upward to about -50 millivolts
and stays there for about a microsecond before the sodium channel is opened.
The opening of the sodium channel causes the voltage level to rise just above zero (maybe as high as a postive 20
millivolts). By definition, physiologists have labeled this "depolarization".
Once the voltage level peaks (spikes), the sodium channel closes. Upon closure of the sodium channel, the calcium channel is opened.
Only a small number of calcium ions are released. The calcium ion's purpose is to create a small time delay by electrically balancing the potassium
ions as the potassium channel is now being opened. The result of this balancing is that the voltage level begins to drop but
only gradually. Physiologists call this the "plateau".
After no more than 3/10ths of a second (defining the horizontal length of the plateau), the calcium channel is closed and
the potassium ions are released full force causing the voltage level to take a fairly steep nose dive. This is referred to
by the physiologists as "repolarization"...as the membrane "battery" eventually returns to the -70mv level again. Then the process is
repeated again with the next heartbeat.
Nerve Activated Stimulation of the SA and AV Nodes
The other power source for the beating of the heart is nerve activated. It is still a chemical activity that is controlling
a voltage potential, but it has to be activated with continuous nerve impulses in order to take place. These nerve impulses
are applied at the sinoartrial and atrial ventriclular nodes.
The letter "C" refers to the point in time of the diastole when the nodes are "most permeable
to calcium ions". And "D" is when they are "most permeable for potassium ions".
Putting The Two Power Supplies Together
Now that we have covered the two sources of power for the heart, it is time to see how these systems work together.
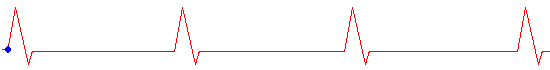
One way to analyze this is to look at an actual ECG reading. You have seen them many times, I am sure. These are
the heartbeat blips that get recorded on graph paper and are often digitized as moving white light on ECG monitors.
You probably remember them looking something like this:
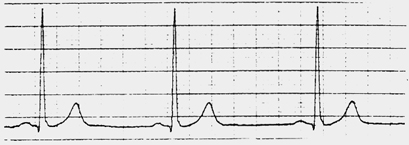
Actually, the shape of the pulse-wave looks more like what is shown below. This is my actual resting pulse that
was recorded on June 20, 1988 just prior to a treadmill test.
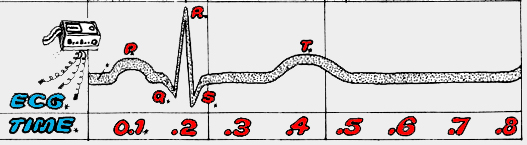
If we take a closeup look at one of the pulses, we can divide it up into distinct parts:
Following the standard practice of the medical professionals and physiologists, I have marked the pulse
with P, Q, R, S and T. The "P" part of the wave signals the beginning of the heartbeat.
This is the diastolic mode when the spreading of excitation (voltage change) is affecting the membrane of
both the left and right atria. The time from the beginning of the P wave to the beginning of the R wave measures
the time for impluse conducton from atria to the ventricles. During this same time, a nerve impluse is sent to the
AV node. Doctors look at the QRS segments together. They are referred to as the QRS Complex and it represents
the invasion of the ventricular musculature by excitary impulses. Whereas the P wave is the shape of the atrium excitation,
the QRS wave is the shape of the ventricular excitation. The height of the P wave is much smaller than the QRS,
because the ventricular mass is much larger than that of the atria. If you look at the time intervals, you also
see that the time interval for the P wave is greater than that of the QRS wave. This is because the impulse
conduction for the ventricles is much more rapid.
During the time between the S and T segments of the recorded electrical signals, the ECG registers zero.
That is, all of the ventricular muscle is in the same depolarized state with no potential difference between the
outside and inside of the membrane. The "T-wave" results from ventricular repolarization as different parts of
the ventrical repolarize at different times.
I hope you're still with me. I apologize for dragging you through this very technical process. My goal is
for the reader to have enough knowledge to understand how blood pressure and heart rate are related, and to also
explain how blood pressure medicine can intrude on the process so as to better regulate the pressure to safe levels. We still have a little ways to go with my thoroughness; so I hope I haven't confused you up to this point.
One of my "teacher" heroes is the late Isaac Asimov. I have many of his books. He was gifted with the ability to take very complex subjects and write about them in such a way that most anybody who could read English would have no trouble understanding. Consequently, when I am getting ready to try and understand a complex scientific subject, I often start my journey by consulting his many published books. One book that he wrote in 1963 is entitled, The Human Body--Its Structure and Operation.
I found it to be a perfect place to start. For the reader who has never had the pleasure of reading any of Asimov's writing, perhaps reading the following will give you an idea of his extraordinary talent:
"The heart is a noisy organ, as we all know. If you place your ear against someone's chest, you will hear a series of sounds something like: lub--dub----lub--dub----lub--dub. These sounds arise from the slamming of valves. When the ventricles contract, the tricuspid and mitral valves close and that is the 'lub'. When the ventricles relax again, the semilunar valves in the aorta and in the pulmonary artery close, and that is the 'dub'. The 'lub--dub', then, marks the beginning and ending for the period of contraction (or systole). The lapse of time between one 'lub--dub' and the next is the period of relaxation (or diastole)."
If you're like me, you suddenly understand a little better what reference is being made when a doctor writes down two numbers after measuring your blood pressure. The doctor told me the first number is the "systolic pressure" and the second number is the "diastolic pressure" . I also know from these few sentences of the Asimov text that the readings are being taken relative to contractions and relaxation cycles that are taking place in my heart. That's a good start, I think. But as you will soon surmise, I am just getting started toward acquiring a clear understanding of blood pressure.
The "plumbing" between the right side of the heart and the lungs are referred to as the "pulmonary arteries and veins", while the "plumbing" on the left (the return side) is referred to as the "systemic arteries and veins". Both pumps have input and output functions.
The blood leaves the right-side pump via a large orifice called the "pulmonary artery", whereas it enters the left-side pump via the "pulmonary vein". The two largest chambers of the heart are called the "ventricles". The two smaller chambers are called the "atriums". The atriums are just above the ventricles.
There are two valves that separate the atriums from their respective ventricles. The valve on the right (pulmonary side) of the heart is called the "tricuspid". The valve on the left (systemic side) of the heart is called the "mitral", or sometimes "bicuspid". There are two other valves, the "aortic semilunar" and the "pulmonary semilunar". Obviously one is for the aorta and the other one is for the pulmonary artery. I will discuss the functions of these valves in just a moment.
For a better understanding, it is convenient to study the actual blood flow. Since we're dealing with a circular concept, there is really no starting point and finish. Arbitrarily, we will start the tracing of the flow at the right atrium. It has entered the atrium via the vena cava. The tricuspid valve separating the right atrium and right ventricle opens releasing its payload of deoxygenated blood received from other parts of the body. The tissue throughout the body has used up the oxygen, and that is why it is "deoxygentated" at this return part of the heart pumping cycle.
When the right ventricle contracts, the spurting blood causes the tricuspid valve to close and the blood leaves the right ventricle via the pulmonary artery as the blood pressure has also opened the exit valve, the pulmonary semilunar.
From there, the blood travels through the pulmonary plumbing to the capillaries in both of the lungs. The blood is processed in the lungs (supplying the missing oxygen) and then the oxygenated blood is sent through the systemic plumbing to the left side of the heart.
The blood enters the left side of the heart through the pulmonary vein to the left atrium. The mitral valve opens allowing the oxygenated blood to flow into the left ventricle. The left ventricle contracts and the mitral valve closes.
As the left ventricle contraction occurs, the pressure forces open the aortic semilunar valve so that blood leaves via the aorta out to the bodily tissue that desperately need its nutrients and oxygen. Then the whole cycle starts again.
When a person has a sphygmomanometer's cuff placed around their upper arm, it is being placed there to pinch off the blood flow in the large artery that is near the surface of the muscle close to where the arm bends. Our objective with this device is to measure the pressure of the blood that is being exerted against the walls of this artery. Obviously if one wants to pinch the artery shut, they have to exert enough pressure on its outside wall that exceeds the pressure being exerted from the inside the artery outward.
The cuff exerts pressure by pumping air into its chambers. The pressure (force per unit of area) in those chambers is conventionally related to the amount of pressure that it would take to raise a column of mercury a certain height. Some sphygmomanometers actually use columns of mercury to allow the tester to see the rising mercury. Others, like the analog version that I own, instead use an analog pressure gauge to show the reading. The pressure gauge version has a spring mechanism that simulates the same resistance that would be achieved with the resistive weight of mercury. In actuality there are many different versions that do an equally effective job of simulating the mercury column rise. Some are analog and some are digital.
Since I know that my blood pressure could equal or exceed the amount of force necessary to raise the column of mercury 200 mm, I have to pump enough air in the cuff to exceed that internal artery pressure. I therefore usually pump it up to where the gauge is reading 230 mm. The cuff has an air leak valve that allows me to slowly leak air from the pressure cuff. This causes the pressure to drop, and eventually the blood will start to flow again through the artery.
I place a stethoscope on the artery where the arm bends so that I can hear the point at which the blood starts flowing again. I watch the cuff pressure drop as I gradually release the air in the cuff. This lets me know when the pressure inside the cuff exactly equals the pressure being exerted inside the artery from blood flow. I hear the pulsing of the blood "boomp, boomp,boomp...". The volume of the sound in the stethoscope begins to fade as the ventricles go from full contraction (systole) to the relaxed state (diastole). When it reaches diastole, I cannot hear the pulse anymore. I note the reading on the gauge. This is the point of diastole.
A slightly high systolic reading usually does not alarm doctors as much as a high diastolic reading. It is normal for the systolic reading to become higher with the aging process. This is due to stiffening of the arterial tree.
The diastolic reading is of more concern, because it represents the pressure being exerted when the ventricles are supposed to be relaxed. A high reading here can have much more serious implications. It can indicate some very serious cardiovascular or even kidney problems.
I ran across a white paper by Dr. Murray Epstein covering the subject of high blood pressure. Apparently even though a gradually increasing systolic is usually of no concern for people under 50, the situation changes for older age groups. The study pointed out that beyond age 50-60 years old, increasing systolic blood pressure is associated with an increasing risk of cardiovascular events. He cited one study that showed increased risk of 50% for people with systolic readings above 140 mm Hg.
Managing Your Blood Pressure
There are number of things that everyone can do to help control their blood pressure a little better. Among these are proper diet (not too much salt or cholesterol), weight maintenance (not too fat), and stress management (don't sweat the small stuff). All of these factors have an affect on your blood pressure.
However, don't be fooled into believing that management of those items will prevent high blood pressure. As my cardiologist explained, "They can maybe regulate your blood pressure 10 to 15 units of mercury on either the systolic or diastolic sides of the measurement. But heredity factors can cause the pressure to fall way beyond these controllable parameters. No amount of diet, weight and stress management can make up for poor blood pressure characteristics that are inherited." He told me that I have a very healthy resting pulse, my cholesterol is good, and my treadmill results show that exercise is not a large contributing factor. My trouble is heredity.
Exercise is always good for you. Walking won't directly affect your blood pressure profile, but it can have a positive affect on your ability to manage stress and to prevent cardiovascular problems related to blood pressure. For example, exercise seems to help a person's body to handle cholesterol levels better over time. Exercise helps inhibit weight gains. Exercise can slow down a person's resting pulse.
With all due respect for these indirect improvements due to diet, stress management and exercise,
I am still faced with having to take blood pressure medicine for the rest of my life.
Originally, my cardiologist prescribed a drug called Lotrel. Lotrel contains amlodipine (5mg) and benazepril (20mg) in combination.
Amlodipine is a "calcium channel blocker" and benazepril is a "angiotensin-converting enzyme (ACE)
inhibitor".
A calcium ion channel blocker (also called calcium antagonist) slows the influx of
calcium in the smooth muscle cells. This results in decreased arterial resistance and less oxygen
demand. Elevated resistance to blood flow is one of the biggest causes of high blood pressure.
ACE is an enzyme normally found in the capillary endothelium throughout the vascular
system. It converts angiotensin I (a part of the renin-angiotensin-aldosterone mechanism of the
kidney) to angiotensin II, the final step in the renin-angiotensin mechanism.
An ACE inhibitor inhibits the production of aldesterone. Aldesterone is the "bad guy" body chemistry
that causes blood vessel stiffening and therefore causes constriction of the endothelium.
I continued taking Lotrel until my dentist discovered something that forced a change.
She had received a medical notice distributed to the dental profession stating that Lotrel was causing puffed
and redness of the gums. And among those dental patients using it, there was a high incidence of
gingivitus. I was having some of these problems even though I was exercising good dental hygiene.
Consequently, my dentist suggested that I have the cardiologist switch me to a different drug.
What was strange is that the sales person for Lotrel would not acknowledge that there
was such a problem with their drug. I practically had to beat the doctor in the head to have him write
me a new prescription. He was believing his pharmaceutical sales rep.
Anyway, the cardiologist finally did prescribe an alternate drug called, Diovan HCT. This
is a different kind of "blocker" that instead of being a calcium channel blocker, it blocks the affects
of angiotensin II described earlier.
Changing drugs, cleared up the gum problem quickly. I have come to the conclusion that you have to watch pharmaceutical salesmen as closely as you do stockbrokers. In many cases, they don't care about you...they merely want to make the most money possible. Lotrel is a very expensive and profitable drug. I am sure this is why there is so much
"cover up" for some of its negative side-affects.
Diovan initially worked pretty well for me. However, there were days where it did not seem too effective. Nonetheless, I stuck with Diovan for a couple of years before switching to another drug prescribed by a new doctor. It is called lisinopril. It is an ACE-inhibitor. The great thing about it is that there are generics available and that really drives down the price. On the negative side, many people cannot take the drug if they are plagued by allergies or for some reason have any kind of breathing problems. It makes some people cough persistently. I don't have any of these side-affects. For me, it has been the best blood pressure control pill that I have tried so far.